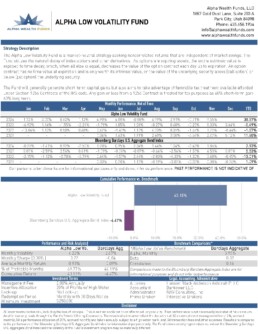
Monthly Return of Alpha Low Volatility:
| Jan | Feb | Mar | Apr | May | Jun | Jul | Aug | Sept | Oct | Nov | Dec | Total | |
|---|---|---|---|---|---|---|---|---|---|---|---|---|---|
| Alpha Low Volatility 2025 | 1.65% | -0.24% | 1.85% | 3.28% | |||||||||
| 60% S&P 500 TR/40% U.S. Bond Aggregate | 1.88% | 0.31% | -3.37% | -1.45% | |||||||||
| Alpha Low Volatility 2024 | 1.72% | 3.00% | 0.62% | 1.12% | 4.90% | 4.00% | -0.08% | 6.89% | 2.91% | -0.71% | 8.65% | 0.07% | 38.66% |
| 60% S&P 500 TR/40% U.S. Bond Aggregate | 0.90% | 2.64% | 2.30% | -3.46% | 3.65% | 2.53% | 1.66% | 2.03% | 1.82% | -1.54% | 3.94% | -2.08% | 15.04% |
| Alpha Low Volatility 2023 | -6.92% | 1.14% | -1.55% | -2.21% | -1.79% | 1.05% | 1.59% | -8.27% | 0.68% | -0.25% | 8.33% | 3.64% | -5.49% |
| 60% S&P 500 TR/40% U.S. Bond Aggregate | 5.00% | -2.50% | 3.22% | 1.18% | -0.17% | 3.82% | 1.90% | -1.21% | -3.88% | -1.89% | 7.29% | 4.26% | 17.67% |
| Alpha Low Volatility 2022 | -10.04% | 1.13% | 0.5% | 0.68% | 3.67% | -9.47% | 1.12% | 4.23% | 8.39% | -1.57% | 1.77% | -0.44% | -1.57% |
| 60% S&P 500 TR/40% U.S. Bond Aggregate | -3.97% | -2.24% | 1.12% | -6.75% | 0.37% | -5.58% | 6.51% | -3.58% | -7.25% | 4.34% | 4.82% | -3.64% | -15.79% |
| Alpha Low Volatility 2021 | 0.34% | 1.43% | 1.91% | 2.40% | 3.30% | -5.56% | 2.47% | 5.12% | 11.60% | ||||
| 60% S&P 500 TR/40% U.S. Bond Aggregate | 0.70% | 2.33% | 2.38% | 3.04% | -4.65% | 7.01% | -0.69% | 4.48% | 15.08% |
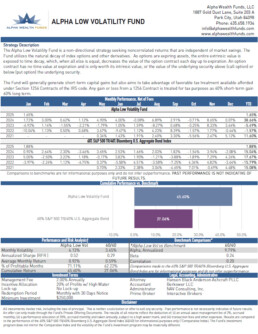
Performance
| Time Horizon | Manager (net of fees) | S&P 500 ETF |
|---|---|---|
| Last 30 Days | -1.5% | -0.25% |
| Last 90 Days | 2.58% | 3.2% |
| Last 365 Days | 17.4% | 13.45% |
| Since Inception (Annualized) | 19.3% | 20.3% |
| 2018 (YTD) | 7.2% | 7.5% |
| 2017 | 19.4% | 21.7% |
Risk Metrics (Last 365 Days)
| Metric | Manager (net of fees) | 60/40 Benchmark |
|---|---|---|
| Volatility | 11.9% | 12.6% |
| Sharpe Ratio | 1.79 | 1.05 |
| Sortino Ratio | .64 | 1.32 |
| Maximum Drawdown | -6.27% | -10.1% |
| Value-at-risk (95%, 1 week) | -2.7% | -2.9% |
March 2025
Feb 2025
Jan 2025
Dec 2024